Note: Asian languages are not supported for Word report. If you experience any issues we recommend to use English as Microsoft Windows system language.
Lines in consistency plots represent within-trial mean values, i.e. there is one line for each trial (default colours:
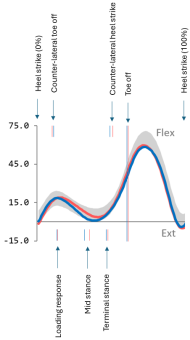
The following figure shows the meaning of the graph annotations in the Word report.
Breaking time: Time between ON and MS events.
Propulsion time: Time between MS and OFF events.
Max loading rate = 0.8 * max loading force / time from ON to 80% of max loading force
Unloading rate = 0.8 * max unloading force / time from 80% of max unloading force to OFF
Rearfoot load: Mean of rearfoot load. The load within the first 12 cm (empirical value) of the AP component of COP path is timely associated with the rear foot, the other with the forefoot.
Forefoot load - Mean of forefoot load.
Rearfoot duration - Time from ON to 12 cm of the AP component of COP path.
Forefoot duration - Time from 12 cm of the AP component of COP path to OFF.
Diff: left value - right value
Asymmetry angle: Based on Zifchock RA, Davis I, Higginson J, Royer T. The symmetry angle: a novel, robust method of quantifying asymmetry. Gait Posture. 2008 May;27(4):622-7. doi: 10.1016/j.gaitpost.2007.08.006. Epub 2007 Oct 29. PMID: 17913499.
The appearance of the curves in the graphs can be changed by modifying the file Templates/settings.php with a text editor. The file includes a section with "Word report settings". Each line includes a description of the setting and the available option, such as line colors and whether all trials are plotted or individual means.
Note: While saving custom Word template it is very important to save it in compatibility mode. To do so make sure that in “Save As” dialog checker “Maintain compatibility with previous versions of Word” is checked before saving edited document. Failing to do so will significantly slow editing and scrolling the Word document.
Word graph layout can be changed at Templates\
Overlay pictures in Gait session or Gait Overlay session by default show the trial with lowest camera ID. To change the camera to show go to [your project]\Templates\settings.php and change $overlay_sagittal_camera_number. The values is a filename suffix. For example, if file is named "Gait FB - CAST 3_Miqus_9_14737.avi", use "14737". Set this to 'default' to automatically select video files with the lowest ID. Applies only to Gait and Gait Overlay report. It has no effect on Static Overlay nor Stabilometry report.
Consistency graphs show representative trial in bold. Representative trial is defined as the trial with the lowest RMSE of vertical GRF to mean GRF. Both left and right GRF must exist for representative trial to be found. If single representative trial cannot be found, e.g. when exactly two trials exist, first trial satisfying the criteria is selected. Finding representative trial works only if both left and right GRF exist in first active trial. To skip finding representative trial go to [your project]\Templates\settings.php and change $find_representative_trial to false. In that case no curve in consistency graphs will be bold and page with force overlay screenshots will not be shown.
Word report or PDF report are generated which shows up to 4 static trials with up to 4 cameras in each trial with overlay of force vectors, spine and pelvis markers and a grid of one of the principal planes. Picture is taken at the moment when force vectors have minimal difference. Comments entered at module pane next to each measurement are shown in the report.
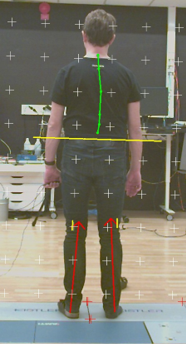
Legend to the picture:
Yellow vertical line connects L_IPS and R_IPS (posterior superior iliac spine)
Green vertical curve connects spine markers
Red vertical arrows represent vector of ground reaction force
Small yellow vertical lines represent vertical projection of COP to the height of the end of the force vector (so that users can see if the force vector is vertical or not).
Red crosses are force plate corners
Grey crosses represent principal plane of global coordinate system. Depending on view it can be sagittal or frontal plane.
Overlay pictures are also shown in Word report for marker based session if above mentioned requirements are met. By default pictures for the first 4 videos are shown. To show other videos (if there is more than 4 videos) or to change the order of videos in Word report, go to [your project]\Templates\settings.php and change $overlay_camera_serial_numbers to list of serial numbers of videos you want to be shown in the report. Pictures will be shown in the same order as specified in $overlay_camera_serial_numbers. This setting has no effect on Gait and Gait Overlay reports.
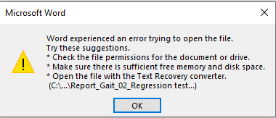
When number of gait cycles is very high, e.g. when walking on treadmill for extended time or when session includes very large number of trials, Word report might not be generated and following Word error will pop up. Unfortunately, the only way to avoid this issue is to reduce number of trials or crop a trial to generate less cycles.
PDF report is created from Word report. It has the same content as Word report and it is shown in default system application.